Difference between revisions of "TeamHope"
(→Timeline: Updated with complete dates) (Tag: Visual edit) |
(→Division of labour) (Tag: Visual edit) |
||
| Line 99: | Line 99: | ||
== Division of labour == | == Division of labour == | ||
| − | + | Ingvild: | |
| + | * Mode selector component | ||
| + | * Input min/max (user&admin) component | ||
| + | * UserInput component | ||
| + | Kristian | ||
| + | * Visualizer | ||
| + | * AdminMode | ||
| + | Carl | ||
| + | * Search org unit | ||
| + | * Stock selector | ||
| + | * API-calls | ||
| + | Mikkel | ||
| + | * Select to/from | ||
| + | * Stock selector | ||
| + | * FrontEnd | ||
| + | |||
| + | See our Github page for more information about each task. | ||
=== Components === | === Components === | ||
| Line 174: | Line 190: | ||
- Estimate calculator (EstimateCalculator) | - Estimate calculator (EstimateCalculator) | ||
| − | === | + | === Repository === |
| − | |||
| − | |||
| − | |||
| − | |||
| − | |||
| − | |||
| − | |||
| − | |||
| − | |||
| − | |||
| − | |||
| − | |||
| − | |||
| − | |||
| − | |||
| − | |||
| − | |||
| − | |||
| − | |||
| − | |||
| − | |||
| − | |||
| − | |||
| − | |||
| − | |||
| − | |||
| − | |||
| − | |||
| − | |||
| − | |||
| − | |||
| − | |||
| − | |||
https://github.uio.no/TeamHope/project | https://github.uio.no/TeamHope/project | ||
Revision as of 15:00, 3 November 2017
Contents
Group members
Mikkel Bakken
Ingvild Larsen
Carl Petter Boehlke
Kristian Pedersen
Assignment
Requirements
Description
The application shall have two modes:
- Estimates, showing estimated months left of a selected stock, for chosen organization units.
- Time trend, showing time trend of stock for a single organization unit.
Functional requirements
The user can choose between the two modes described above.
Both:
- Default min/max boundaries can be set by an administrator (administrator view in mockup).
- The user can specify their own desired min/max boundaries as well (user view in mockups).
- If the administrator has not set a default min/max boundary, there is no default min/max boundary in the plot.
For "Estimates":
- The user can specify one stock type, and multiple organization units.
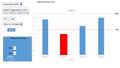
- Show current estimates as columns in a column diagram.
- Columns outside the specified min/max boundaries will be highlighted.
- Estimates are calculated based on average consumption over the last 3 months, and current stock levels ((current stock) / (average consumption) = estimated months left).
- Default min/max boundaries are shared by all organization units.
For "Time trend":
- The user can select an organization unit, and a stock type.
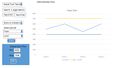
- Show time trend(months) of available stock as a graph.
- The min/max boundaries are shown as lines in the graph.
- The user can choose the time period they wish to see the time trend for (by default the last 6 months).
- Default min/max boundaries are associated with a specific organization unit and stock type.
Mockups

Mocup of user view for estimates mode
Mockup of admin view for estimates mode

Mockup of user view for time trend mode
Mockup of admin view for time trend mode


Architecture
We have chosen React, because of the view focused framework. We also feel that the group as a whole has more experience with React.
- Highcharts
Licensing
To do
Timeline
| Milestone | Goal | Date | Completed | Comment |
|---|---|---|---|---|
| 1 | Wiki page ready | November 1st | October 27th | Will be improved more as the project evolves |
| 2 | Start of coding | October 31st | October 27th | |
| 3 | Prototype ready | November 7th | November 3rd | |
| 4 | App ready for use | November 20th |
Division of labour
Ingvild:
- Mode selector component
- Input min/max (user&admin) component
- UserInput component
Kristian
- Visualizer
- AdminMode
Carl
- Search org unit
- Stock selector
- API-calls
Mikkel
- Select to/from
- Stock selector
- FrontEnd
See our Github page for more information about each task.
Components
- Select mode (ModeSelector)
Estimates (Estimates):
Sidebar:
- Search for organization units (MultipleOrgSearch)
- Search field (OrgSearch)
- Selected orgs list (OrgList)
- Input min/max boundary (UserBoundaryInput)
- Min (InputNumber)
- Max (InputNumber)
- Select stock (StockSelector)
- Showbutton (Showbutton)
- Admin box (AdminBox)
- Input min/max boundary (AdminBoundaryInput)
- OK button (OK)
Visualization:
- Diagram (EstimateDiagram)
Time trend (TimeTrend):
Sidebar:
- Search for organization unit (SingleOrgSearch)
- Search field (OrgSearch)
- Input min/max boundary (UserBoundaryInput)
- Min (InputNumber)
- Max (InputNumber)
- Select stock (StockSelector)
- Select period (PeriodSelector)
- From (SelectDate)
- To (SelectDate)
- Showbutton (Showbutton)
- Admin box (AdminBox)
- Input min/max boundary (AdminBoundaryInput)
- OK button (OK)
Visualization:
- Time trend (TimeTrendGraph)
Background:
- Stock level retriever (StockFetcher)
- Estimate calculator (EstimateCalculator)