Difference between revisions of "Whole Brain Connectivity Atlas"
Jang@uio.no (talk | contribs) |
Jang@uio.no (talk | contribs) (Tag: Visual edit) |
||
| Line 1: | Line 1: | ||
| + | <span style="font-family: georgia, serif;">The Whole Brain Connectivity Atlas is an interactive resource providing access to brainwide experimental tract-tracing data showing the distribution of axonal connections arising from the primary somatosensory cortex (SI) in the rat brain. </span><span style="font-family: georgia, serif;">The image repository contains ~1200 coronal images showing data from 6 axonal tracing experiments. </span> | ||
| + | |||
<span style="font-family: georgia, serif;">Re-use of data from this repository is allowed provided that reference is given to the following publication: Zakiewicz IM, van Dongen YC, Leergaard TB, Bjaalie JG (2010) Workflow and database system for mapping the axonal connectivity of the rat brain. PLoS ONE 2011;6(8):e22669 </span> | <span style="font-family: georgia, serif;">Re-use of data from this repository is allowed provided that reference is given to the following publication: Zakiewicz IM, van Dongen YC, Leergaard TB, Bjaalie JG (2010) Workflow and database system for mapping the axonal connectivity of the rat brain. PLoS ONE 2011;6(8):e22669 </span> | ||
| − | + | '''Shortcut to Access images''' | |
| − | |||
| − | |||
== <span style="font-family:georgia,serif;">About</span> == | == <span style="font-family:georgia,serif;">About</span> == | ||
| − | <span style="font-family: georgia, serif;">The | + | <span style="font-family: georgia, serif;">The <span style="font-family: georgia, serif;">Whole Brain Connectivity Atlas</span> is a resource for mapping and sharing of connectivity data derived from histological axonal tract-tracing experiments. It has been developed to provide access to high-resolution images of histological sections showing the distribution of anterogradely labelled axons arising from the rat primary somatosensory and primary motor cortex (SI ans MI). </span> |
| − | |||
| − | <span style="font-family: georgia, serif;"> | ||
| − | <span style="font-family: georgia, serif;"> | + | T<span style="font-family: georgia, serif;">he atlas contains the results from six experiments in which an anterograde tracer, either ''biotinylated dextran amine ''(BDA) or ''Phaseolus vulgaris leucoagglutinin ''(Pha-L), was injected in the SI forelimb or whisker representations in M1. The results include images of ~1500 coronal sections showing the distribution of tracer labelled axons across the entire rat brain.</span> |
<span style="font-family:georgia,serif;"><gallery class="center" mode="traditional" widths="300px"> | <span style="font-family:georgia,serif;"><gallery class="center" mode="traditional" widths="300px"> | ||
| Line 21: | Line 19: | ||
*<span style="font-family:georgia,serif;">Tract-tracing results from six experiments in which an anterograde tracer was injected in the forelimb or whisker representations in the rat SI or MI</span> | *<span style="font-family:georgia,serif;">Tract-tracing results from six experiments in which an anterograde tracer was injected in the forelimb or whisker representations in the rat SI or MI</span> | ||
| − | *<span style="font-family:georgia,serif;">About | + | *<span style="font-family:georgia,serif;">About 1200 images of coronal sections showing:</span> |
**<span style="font-family:georgia,serif;">the distribution of labelling (BDA or Pha-L)</span> | **<span style="font-family:georgia,serif;">the distribution of labelling (BDA or Pha-L)</span> | ||
**<span style="font-family:georgia,serif;">cytoarchitectural features (Neutral red or thionine counterstaining)</span> | **<span style="font-family:georgia,serif;">cytoarchitectural features (Neutral red or thionine counterstaining)</span> | ||
| Line 32: | Line 30: | ||
<span style="font-family:georgia,serif;">The tract-tracing experiments were conducted in four adult Sprague Dawley rats and two adult Wistar rats. In each animal, an anterograde axonal tracer (biotinylated dextran amine, BDA or Phaseolus vulgaris leucoagglutinin, Pha-L) was iontophoretically injected in the whisker or forelimb representation of SI (five cases) or MI (one case). Coronal brain sections were stained to visualize BDA or Pha-L and counterstained to visualize cytoarchitectural features. Selected sections were stained for cytochrome oxidase to visualize the characteristic SI barrel organization. Images were obtained through an automated Olympus Bx52 microscope, equipped with a high-precision motorized stage running the Neurolucida v6.0 Virtual Slice software (MicroBrightField Inc., Williston, VT, USA). (For further details, see Zakiewicz et al., 2011, PLoS One, 6(8):e22669)</span> | <span style="font-family:georgia,serif;">The tract-tracing experiments were conducted in four adult Sprague Dawley rats and two adult Wistar rats. In each animal, an anterograde axonal tracer (biotinylated dextran amine, BDA or Phaseolus vulgaris leucoagglutinin, Pha-L) was iontophoretically injected in the whisker or forelimb representation of SI (five cases) or MI (one case). Coronal brain sections were stained to visualize BDA or Pha-L and counterstained to visualize cytoarchitectural features. Selected sections were stained for cytochrome oxidase to visualize the characteristic SI barrel organization. Images were obtained through an automated Olympus Bx52 microscope, equipped with a high-precision motorized stage running the Neurolucida v6.0 Virtual Slice software (MicroBrightField Inc., Williston, VT, USA). (For further details, see Zakiewicz et al., 2011, PLoS One, 6(8):e22669)</span> | ||
| − | + | ||
<br/><span style="font-family:georgia,serif;"><gallery class="center" mode="traditional" widths="300px"> | <br/><span style="font-family:georgia,serif;"><gallery class="center" mode="traditional" widths="300px"> | ||
File:NR_vs_no_stain_final.jpg|The location of injection sites and BDA labelling can be localized on the basis of anatomical landmarks and cytoarchitectonic features. | File:NR_vs_no_stain_final.jpg|The location of injection sites and BDA labelling can be localized on the basis of anatomical landmarks and cytoarchitectonic features. | ||
| Line 98: | Line 96: | ||
|} | |} | ||
| − | |||
| − | |||
| − | |||
| − | |||
| − | |||
| − | |||
| − | |||
| − | |||
| − | |||
| − | |||
| − | |||
| − | |||
| − | |||
| − | |||
== <span style="font-family:georgia,serif;">Access images</span> == | == <span style="font-family:georgia,serif;">Access images</span> == | ||
<span style="font-family:georgia,serif;">Re-use of data from this repository is allowed provided that reference is given to the following publication: Zakiewicz IM, van Dongen YC, Leergaard TB, Bjaalie JG (2010) Workflow and database system for mapping the axonal connectivity of the rat brain. PLoS ONE 2011;6(8):e22669</span> | <span style="font-family:georgia,serif;">Re-use of data from this repository is allowed provided that reference is given to the following publication: Zakiewicz IM, van Dongen YC, Leergaard TB, Bjaalie JG (2010) Workflow and database system for mapping the axonal connectivity of the rat brain. PLoS ONE 2011;6(8):e22669</span> | ||
| − | |||
| − | |||
{| class="wikitable" style="margin: 1em auto 1em auto;" | {| class="wikitable" style="margin: 1em auto 1em auto;" | ||
|- | |- | ||
| − | ! Injection site<br/> | + | ! Injection site<br /> |
! Location area | ! Location area | ||
! Images | ! Images | ||
! About the case | ! About the case | ||
|- | |- | ||
| − | | style="text-align: center;" | [[File:Case R602.png|center]]<br/> | + | | style="text-align: center;" | [[File:Case R602.png|center]]<br /> |
| SI forelimb, BDA (R601) | | SI forelimb, BDA (R601) | ||
| [http://cmbn-navigator.uio.no/navigator/filmstrip_viewer.html?entityType=animal&entityId=1501&metadataKeyName=Bregma%20Level Open viewer] | | [http://cmbn-navigator.uio.no/navigator/filmstrip_viewer.html?entityType=animal&entityId=1501&metadataKeyName=Bregma%20Level Open viewer] | ||
| [https://wiki.uio.no/projects/navigator3/images/2/2e/Metadata_R601.pdf More details (pdf)] | | [https://wiki.uio.no/projects/navigator3/images/2/2e/Metadata_R601.pdf More details (pdf)] | ||
|- | |- | ||
| − | | style="text-align: center;" | [[File:Case R602.png|center]]<br/> | + | | style="text-align: center;" | [[File:Case R602.png|center]]<br /> |
| SI whisker D2, BDA (R602) | | SI whisker D2, BDA (R602) | ||
| [http://cmbn-navigator.uio.no/navigator/filmstrip_viewer.html?entityType=animal&entityId=1502&&metadataKeyName=Bregma%20Level Open viewer] | | [http://cmbn-navigator.uio.no/navigator/filmstrip_viewer.html?entityType=animal&entityId=1502&&metadataKeyName=Bregma%20Level Open viewer] | ||
| [https://wiki.uio.no/projects/navigator3/images/3/3a/Metadata_R602.pdf More details (pdf)] | | [https://wiki.uio.no/projects/navigator3/images/3/3a/Metadata_R602.pdf More details (pdf)] | ||
|- | |- | ||
| − | | [[File:Case R603.png|center]]<br/> | + | | [[File:Case R603.png|center]]<br /> |
| SI forelimb, BDA (R603) | | SI forelimb, BDA (R603) | ||
| [http://cmbn-navigator.uio.no/navigator/filmstrip_viewer.html?entityType=animal&entityId=1503&metadataKeyName=Bregma%20Level Open viewer] | | [http://cmbn-navigator.uio.no/navigator/filmstrip_viewer.html?entityType=animal&entityId=1503&metadataKeyName=Bregma%20Level Open viewer] | ||
| [https://wiki.uio.no/projects/navigator3/images/e/eb/Metadata_R603.pdf More details (pdf)] | | [https://wiki.uio.no/projects/navigator3/images/e/eb/Metadata_R603.pdf More details (pdf)] | ||
|- | |- | ||
| − | | [[File:Case R604.png|center]]<br/> | + | | [[File:Case R604.png|center]]<br /> |
| SI whisker D3, BDA (R604) | | SI whisker D3, BDA (R604) | ||
| [http://cmbn-navigator.uio.no/navigator/filmstrip_viewer.html?entityType=animal&entityId=1504&metadataKeyName=Bregma%20Level Open viewer] | | [http://cmbn-navigator.uio.no/navigator/filmstrip_viewer.html?entityType=animal&entityId=1504&metadataKeyName=Bregma%20Level Open viewer] | ||
| [https://wiki.uio.no/projects/navigator3/images/d/d3/Metadata_R604.pdf More details (pdf)] | | [https://wiki.uio.no/projects/navigator3/images/d/d3/Metadata_R604.pdf More details (pdf)] | ||
|- | |- | ||
| − | | [[File:Case R605.png|center]]<br/> | + | | [[File:Case R605.png|center]]<br /> |
| forelimb, Pha-L (R605) | | forelimb, Pha-L (R605) | ||
| [http://cmbn-navigator.uio.no/navigator/filmstrip_viewer.html?entityType=animal&entityId=1505&metadataKeyName=Bregma%20Level Open viewer] | | [http://cmbn-navigator.uio.no/navigator/filmstrip_viewer.html?entityType=animal&entityId=1505&metadataKeyName=Bregma%20Level Open viewer] | ||
| [https://wiki.uio.no/projects/navigator3/images/d/d8/Metadata_R605.pdf More details (pdf)] | | [https://wiki.uio.no/projects/navigator3/images/d/d8/Metadata_R605.pdf More details (pdf)] | ||
|- | |- | ||
| − | | [[File:Case R606.png|center]]<br/> | + | | [[File:Case R606.png|center]]<br /> |
| SI whisker D5, Pha-L (R606) | | SI whisker D5, Pha-L (R606) | ||
| [http://cmbn-navigator.uio.no/navigator/filmstrip_viewer.html?entityType=animal&entityId=1506&metadataKeyName=Bregma%20Level Open viewer] | | [http://cmbn-navigator.uio.no/navigator/filmstrip_viewer.html?entityType=animal&entityId=1506&metadataKeyName=Bregma%20Level Open viewer] | ||
| Line 161: | Line 143: | ||
<span style="font-family:georgia,serif;"><font color="#252525"><font style="font-size: 10pt">To use the Image repositories and viewer, first drag the slider below the row of thumbnail images horizontally to select an anterioposterior level of interest (bregma coordinates are indicated). Click on a thumbnail image to open it in the viewer. </font></font></span> | <span style="font-family:georgia,serif;"><font color="#252525"><font style="font-size: 10pt">To use the Image repositories and viewer, first drag the slider below the row of thumbnail images horizontally to select an anterioposterior level of interest (bregma coordinates are indicated). Click on a thumbnail image to open it in the viewer. </font></font></span> | ||
| − | <br/><span style="font-family:georgia,serif;">The viewer has the following options for navigating the images:</span> | + | <br /><span style="font-family:georgia,serif;">The viewer has the following options for navigating the images:</span> |
*<span style="font-size:small;"><span style="font-family:georgia,serif;">'Zoom' <span style="color: rgb(37, 37, 37); widows: 8;">(zoom in and out by using mouse scroll button or two-finger pan on touchpad)</span></span></span> | *<span style="font-size:small;"><span style="font-family:georgia,serif;">'Zoom' <span style="color: rgb(37, 37, 37); widows: 8;">(zoom in and out by using mouse scroll button or two-finger pan on touchpad)</span></span></span> | ||
| Line 168: | Line 150: | ||
*<span style="font-size:small;"><span style="font-family:georgia,serif;">'Annotation (''under development'')</span></span> | *<span style="font-size:small;"><span style="font-family:georgia,serif;">'Annotation (''under development'')</span></span> | ||
| − | <span style="font-size:small;"><span style="font-family:georgia,serif;">[[File:WBCA tutorial.jpg|center|600px]] | + | <span style="font-size:small;"><span style="font-family:georgia,serif;">[[File:WBCA tutorial.jpg|center|600px]] |
| − | <span style="font-size:small;"><span style="font-family:georgia,serif;"><font color="#252525"><font style="font-size: 10pt">The information about selected section is | + | <span style="font-size:small;"><span style="font-family:georgia,serif;"><font color="#252525"><font style="font-size: 10pt">The information about selected section is available in the upper right corner </font></font>''<font color="#252525"><font style="font-size: 10pt"><span lang="en">with the possibility for downloading the image</span></font></font>''<font color="#252525"><font style="font-size: 10pt">. To download images (at viewer resolution) use the download button in the upper right corner. To print images, either use the print screen functionality of your computer.</font></font></span></span> |
| − | <span style="font-size:small;"><span style="font-family:georgia,serif;"><font color="#252525"><font style="font-size: 10pt">Each section has assigned bregma value, visible under every thumbnail and in the image information corner. The value was assigned based on section landmarks revealed by counterstain or CO-staining and corresponds to the popular stereotaxic rat brain atlas (The Rat Brain In Stereotaxic Coordinates, Paxinos and Watson, 2007). | + | <span style="font-size:small;"><span style="font-family:georgia,serif;"><font color="#252525"><font style="font-size: 10pt">Each section has assigned bregma value, visible under every thumbnail and in the image information corner. The value was assigned based on section landmarks revealed by counterstain or CO-staining and corresponds to the popular stereotaxic rat brain atlas (The Rat Brain In Stereotaxic Coordinates, Paxinos and Watson, 2007).</font></font></span></span> |
| − | + | == History == | |
| + | <span style="font-family:georgia,serif;">2015-04 Atlas moved to NeSys wiki. New image viewer was made available and additional image material has been added</span> | ||
| − | + | <span style="font-family: georgia, serif;">2014-02 Second article with examples of analysis of the rat SI connectivity based on the histological data from the existing database was published: </span> | |
| − | + | <span style="font-family:georgia,serif;">2011-08 Open access following publication in PLoS ONE</span> | |
| − | + | <span style="font-family: georgia, serif;">2011-07 First article published, including an open source platform with histological data from six axonal tract-tracing experi</span>ments: | |
| − | + | <span style="font-family:georgia,serif;">2009-09 Poster / demonstration, 2nd INCF Congress of Neuroinformatics, Plzen, Czech Republic</span> | |
| − | |||
| − | |||
| + | <span style="font-size:small;"><span style="font-family:georgia,serif;"><font color="#252525"><font style="font-size: 10pt"></font></font></span></span><span style="font-size:small;"><span style="font-family:georgia,serif;"><font color="#252525"><font style="font-size: 10pt"></font></font></span></span> | ||
== <span style="font-family:georgia,serif;">Documentation</span> == | == <span style="font-family:georgia,serif;">Documentation</span> == | ||
| − | + | <span style="font-family: georgia, serif;">Zakiewicz IM, Leergaard TB, Bjaalie JG (2014) Brain-wide map of efferent projections from rat barrel cortex, Front. Neuroinform., 05 February 2014 | doi: 10.3389/fninf.2014.00005 <span style="font-family:georgia,serif;">[http://journal.frontiersin.org/article/10.3389/fninf.2014.00005/abstract []]</span></span> | |
| − | |||
| − | |||
| − | <span style="font-family:georgia,serif;"> | + | <span style="font-family:georgia,serif;">Zakiewicz IM, van Dongen YC, Leergaard TB, Bjaalie JG (2010) Workflow and database system for mapping the axonal connectivity of the rat brain. PLoS One. 2011;6(8):e22669. doi: 10.1371/journal.pone.0022669 </span> [http://journals.plos.org/plosone/article?id=10.1371/journal.pone.0022669 []] |
| − | + | <span style="font-family: georgia, serif;">Moene IA, Subramaniam S, Darine D, Leergaard TB, Bjaalie JG (2007). Towards a workbench for rodent brain image data: systems architecture and design. Neuroinformatics; 5: 35-58 </span> | |
| − | + | <span style="font-family:georgia,serif;">Bjaalie JG, Leergaard TB, Lillehaug S, Odeh F, Moene IA, Kjøde JO, Darine D (2005) Database and tools for analysis of topographic organization and map transformations in major projection systems of the brain. Neuroscience 2005; 136:681-696</span> | |
== <span style="font-family:georgia,serif;">Contact</span> == | == <span style="font-family:georgia,serif;">Contact</span> == | ||
Revision as of 14:02, 17 July 2015
The Whole Brain Connectivity Atlas is an interactive resource providing access to brainwide experimental tract-tracing data showing the distribution of axonal connections arising from the primary somatosensory cortex (SI) in the rat brain. The image repository contains ~1200 coronal images showing data from 6 axonal tracing experiments.
Re-use of data from this repository is allowed provided that reference is given to the following publication: Zakiewicz IM, van Dongen YC, Leergaard TB, Bjaalie JG (2010) Workflow and database system for mapping the axonal connectivity of the rat brain. PLoS ONE 2011;6(8):e22669
Shortcut to Access images
Contents
About
The Whole Brain Connectivity Atlas is a resource for mapping and sharing of connectivity data derived from histological axonal tract-tracing experiments. It has been developed to provide access to high-resolution images of histological sections showing the distribution of anterogradely labelled axons arising from the rat primary somatosensory and primary motor cortex (SI ans MI).
The atlas contains the results from six experiments in which an anterograde tracer, either biotinylated dextran amine (BDA) or Phaseolus vulgaris leucoagglutinin (Pha-L), was injected in the SI forelimb or whisker representations in M1. The results include images of ~1500 coronal sections showing the distribution of tracer labelled axons across the entire rat brain.
- SIwiring.jpg
Cortical and subcortical projections of SI (modified from Welker et al., Exp Brain Res 73:411-435).
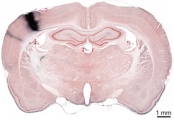
Axonal tracer injection in SI and labelling visible in secondary somatosensory cortex (SII), corpus callosum and thalamus.

Features
- Tract-tracing results from six experiments in which an anterograde tracer was injected in the forelimb or whisker representations in the rat SI or MI
- About 1200 images of coronal sections showing:
- the distribution of labelling (BDA or Pha-L)
- cytoarchitectural features (Neutral red or thionine counterstaining)
- SI chemoarchitecture (every other section stained for cytochrome oxidase)
- assigned bregma values based on the anatomical features revealed by the NR, CO and thionine staining, corresponding to a standard stereotaxic space of the rat brain (Paxinos & Watson, 2007)
Methods
The tract-tracing experiments were conducted in four adult Sprague Dawley rats and two adult Wistar rats. In each animal, an anterograde axonal tracer (biotinylated dextran amine, BDA or Phaseolus vulgaris leucoagglutinin, Pha-L) was iontophoretically injected in the whisker or forelimb representation of SI (five cases) or MI (one case). Coronal brain sections were stained to visualize BDA or Pha-L and counterstained to visualize cytoarchitectural features. Selected sections were stained for cytochrome oxidase to visualize the characteristic SI barrel organization. Images were obtained through an automated Olympus Bx52 microscope, equipped with a high-precision motorized stage running the Neurolucida v6.0 Virtual Slice software (MicroBrightField Inc., Williston, VT, USA). (For further details, see Zakiewicz et al., 2011, PLoS One, 6(8):e22669)
- NR vs no stain final.jpg
The location of injection sites and BDA labelling can be localized on the basis of anatomical landmarks and cytoarchitectonic features.
- Injectionsites final.jpg
Weak counterstaining with Neutral Red is used to visualize cytoarchitecture without compromising the pattern of BDA labelling.
Staining abbreviations
|
Abbreviations |
Description |
|
CO |
Stained for cytochrome oxidase |
|
BDA_ABC |
Stained for biotinylated dextran amine, ABC method |
|
BDA_ABC_NR |
Stained for biotinylated dextran amine, ABC method, counterstained with Neutral Red |
|
Pha-L_PAP |
Stained for Phaseolus vulgaris leucoagglutinin, PAP method |
|
Pha-L_PAP_thio |
Stained for Phaseolus vulgaris leucoagglutinin, PAP method, counterstained with thionine |
|
Pha-L_ABC |
Stained for Phaseolus vulgaris leucoagglutinin, ABC method |
|
Pha-L_ABC_thio |
Stained for Phaseolus vulgaris leucoagglutinin, ABC method, counterstained with thionine |
Access images
Re-use of data from this repository is allowed provided that reference is given to the following publication: Zakiewicz IM, van Dongen YC, Leergaard TB, Bjaalie JG (2010) Workflow and database system for mapping the axonal connectivity of the rat brain. PLoS ONE 2011;6(8):e22669
| Injection site |
Location area | Images | About the case |
|---|---|---|---|
| |
SI forelimb, BDA (R601) | Open viewer | More details (pdf) |
| |
SI whisker D2, BDA (R602) | Open viewer | More details (pdf) |
| |
SI forelimb, BDA (R603) | Open viewer | More details (pdf) |
| |
SI whisker D3, BDA (R604) | Open viewer | More details (pdf) |
| |
forelimb, Pha-L (R605) | Open viewer | More details (pdf) |
| |
SI whisker D5, Pha-L (R606) | Open viewer | More details (pdf) |
Tutorial
To use the Image repositories and viewer, first drag the slider below the row of thumbnail images horizontally to select an anterioposterior level of interest (bregma coordinates are indicated). Click on a thumbnail image to open it in the viewer.
The viewer has the following options for navigating the images:
- 'Zoom' (zoom in and out by using mouse scroll button or two-finger pan on touchpad)
- 'Pan' (left-click and drag the images freely in the viewer, after enlarging the image you can chose the area of interest by left-clicking on the preview window)
- 'Reset' (click “view all” button)
- 'Annotation (under development)
The information about selected section is available in the upper right corner with the possibility for downloading the image. To download images (at viewer resolution) use the download button in the upper right corner. To print images, either use the print screen functionality of your computer.
Each section has assigned bregma value, visible under every thumbnail and in the image information corner. The value was assigned based on section landmarks revealed by counterstain or CO-staining and corresponds to the popular stereotaxic rat brain atlas (The Rat Brain In Stereotaxic Coordinates, Paxinos and Watson, 2007).
History
2015-04 Atlas moved to NeSys wiki. New image viewer was made available and additional image material has been added
2014-02 Second article with examples of analysis of the rat SI connectivity based on the histological data from the existing database was published:
2011-08 Open access following publication in PLoS ONE
2011-07 First article published, including an open source platform with histological data from six axonal tract-tracing experiments:
2009-09 Poster / demonstration, 2nd INCF Congress of Neuroinformatics, Plzen, Czech Republic
Documentation
Zakiewicz IM, Leergaard TB, Bjaalie JG (2014) Brain-wide map of efferent projections from rat barrel cortex, Front. Neuroinform., 05 February 2014 | doi: 10.3389/fninf.2014.00005 []
Zakiewicz IM, van Dongen YC, Leergaard TB, Bjaalie JG (2010) Workflow and database system for mapping the axonal connectivity of the rat brain. PLoS One. 2011;6(8):e22669. doi: 10.1371/journal.pone.0022669 []
Moene IA, Subramaniam S, Darine D, Leergaard TB, Bjaalie JG (2007). Towards a workbench for rodent brain image data: systems architecture and design. Neuroinformatics; 5: 35-58
Bjaalie JG, Leergaard TB, Lillehaug S, Odeh F, Moene IA, Kjøde JO, Darine D (2005) Database and tools for analysis of topographic organization and map transformations in major projection systems of the brain. Neuroscience 2005; 136:681-696
Contact
Connectivity and digital brain atlasing: j.g.bjaalie@medisin.uio.no
Technical issues and functionality: d.a.darine@medisin.uio.no
Credits
NeSys and CMBN atlas development team:
Izabela M. Zakiewicz, M.Sc.
Yvette C. van Dongen, Ph.D
Anna Torbjørg Bore
Jan Olav Kjode, M.Sc.
Ivar Andre Moene, M.Sc.
Trygve B. Leergaard, M.D., Ph.D.
Jan G. Bjaalie, M.D., Ph.D.
Funded by The Research Council of Norway, the Centre for Molecular Biology and Neuroscience, and the European Union
Contributing laboratories
Neural Systems and Graphics Computing Laboratory
Centre for Molecular Biology and Neuroscience & Institute of Basic Medical Sciences
Deptartment of Anatomy
University of Oslo
P.O. Box 1105 Blindern
N - 0317 Oslo
Norway
http://www.nesys.uio.no